
People Living Alone
This activity explores the pattern of People Living Alone across the country.
Click through the tabs to view the resource, or download as a PDF file.
In this resource, students will investigate household composition data to consider which sectors of society of ‘living along’ and what the economic impact will be if these trends of the last decade continue.
‘People are increasingly living alone or in smaller households in Scotland’ https://www.nrscotland.gov.uk/files/statistics/nrs-visual/rgar16/16rgar-infographic.pdf NRS (2017) Scotland’s Population 2016 (page 36)
Why are so many people in Scotland living alone? https://www.scotsman.com/news/why-are-so-many-people-in-scotland-living-alone-1-4522602 a lifestyle choice or an aging population?
- Go to the DataNation homepage: datanation.edina.ac.uk
- Enter your school’s username and password and click login.
Exercise 1.
In this exercise, you will explore the mapping layers to visually interpret the Census data about people living alone.
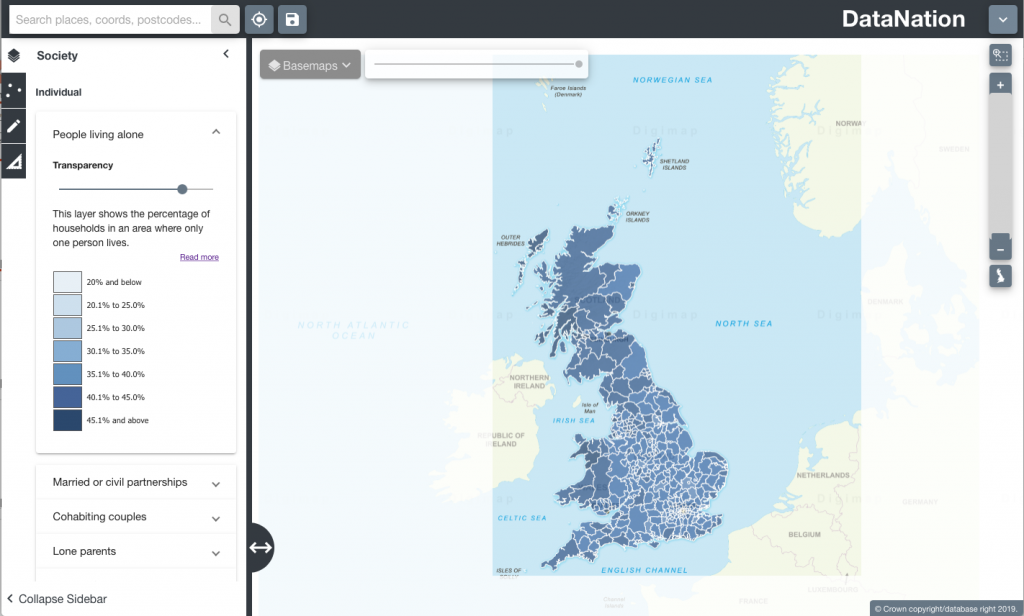
Begin by displaying the ‘People living alone’ layer:
- Click the Society tab in the left-hand panel
- Click on the ‘People living alone’ layer at the top
- The map view will update and display the percentage of households where only one person lives. Ensure you are zoomed out to view the whole country.
- Explore the data by zooming in (double-click the mouse or use the zoom bar on the top right) and panning the map.
Questions, Analysis and Interpretation
- Viewing GB as a whole, what can you conclude about patterns of people living alone?
- Are people more likely to be living alone in rural or urbans areas?
Exercise 2
In this exercise you will explore the raw data behind the maps.
- Click on the map to select a single Local Authority.The selected authority will be highlighted with a red outline and the full statistics for the authority will appear on the left-hand panel.
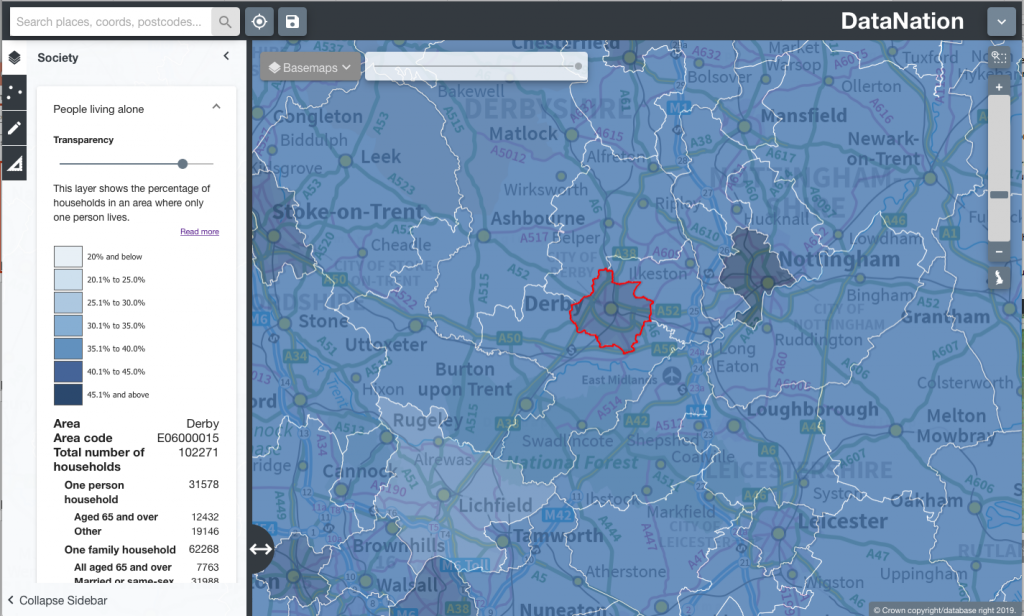
The data on the left-hand panel shows all the related statistics for that area in the Households composition dataset. Click on the different levels of data to view a pie chart of the data.
Questions, Analysis and Interpretation
- Describe the One Person Household data for your local authority, are most people living alone over or under 65?
- Compare with some other authorities (selecting one at a time) do neighbouring local authorities have similar patterns of people living alone?
- Now zoom further into your area of interest, you will see the local authority is broken down into smaller units. Describe the patterns of people living alone across the local authority, how much variation is there?
- Click on the smaller areas to view the raw data
- Zoom into even greater detail and repeat steps 2 & 3.
Exercise 3
Extend this investigation by downloading the raw data for your area of interest by clicking the Download button at the end of the raw data table. Open this data in Excel. Organise and present the data to support your interpretation of the current structure and pattern of household composition, noting sub-divisions within One person, One family, Other household types.

This work is licensed under a Creative Commons Attribution-NonCommercial-ShareAlike 4.0 International License.