Health
This activity explores the Health census data in DataNation to understand patterns of how health impacts day-to-day activities of people across the country.
Click through the tabs below to view, or download the resource as a PDF file
In this resource, students will investigate health care and meeting the needs of the population focusing on those with a long-term health problem or disability. Students will consider what impact a long-term health issue has on an individual’s ability to participate in society.
‘People are living with a growing number of long-term chronic conditions’ reported in BBC report ‘10 charts that show why the NHS is in trouble’ available at https://www.bbc.co.uk/news/health-42572110 24 May 2018
Frailty even during middle age ‘linked to higher mortality risk’ https://www.nursingtimes.net/news/research-and-innovation/frailty-even-during-middle-age-linked-to-higher-mortality-risk/7024873.article Nursing Times, 14 June 201821 Mar 2018
- Go to the DataNation homepage: datanation.edina.ac.uk
- Enter your school’s username and password and click login.
Exercise 1.
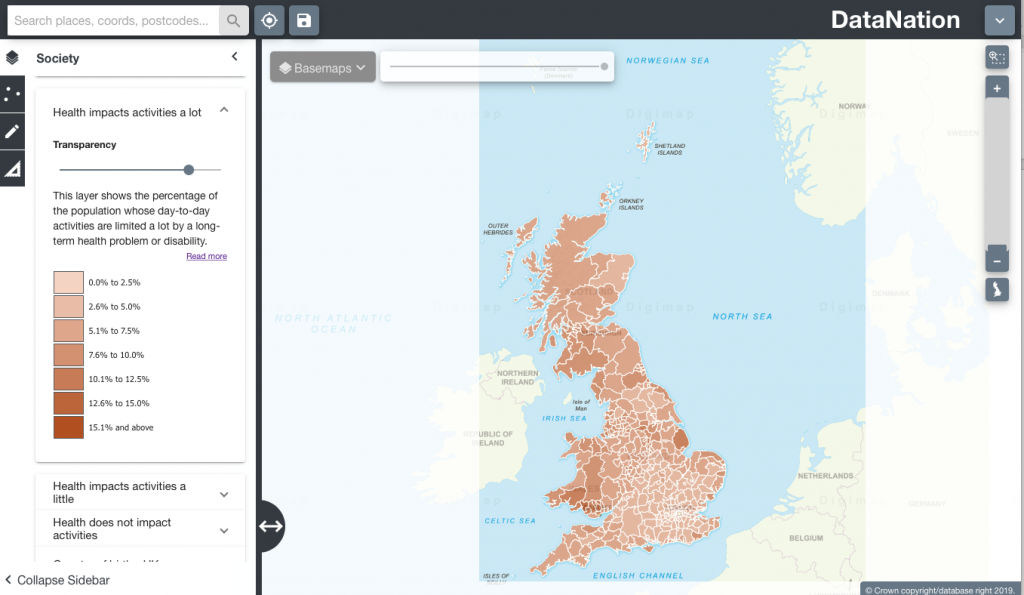
In this exercise, you will explore the mapping layers to visually interpret the Census data about Health. Begin by displaying the ‘Health impacts activities a lot’ layer.
- Click the Society tab in the left-hand panel
- Scroll down to find the ‘Health impacts activities a lot’ layer, click to view the map
- The map will update and display the percentage of the population whose day-to-day activities are limited a lot by a long-term health problem or disability. Ensure you are zoomed out to view the whole country.
- Explore the data by zooming in (double-click the mouse or use the zoom bar on the top right) and panning the map.
Questions, Analysis and Interpretation
- Viewing GB as a whole, what can you conclude about patterns the population who are limited a lot by a long-term health problem or disability?
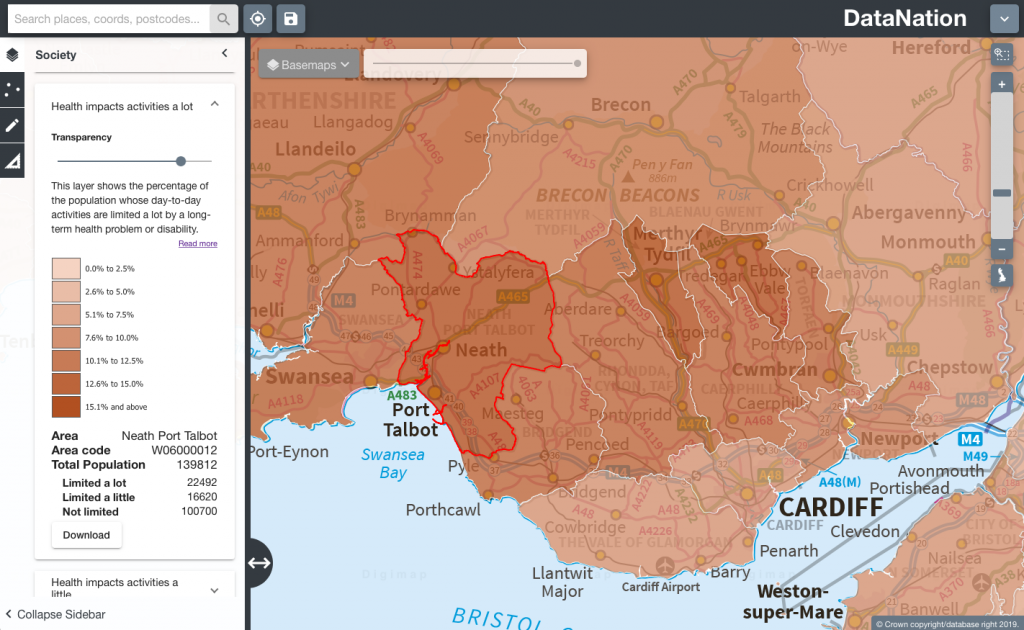
Exercise 2
In this exercise you will explore the raw data behind the maps.
- Click on the map to select a single Local Authority.The selected authority will be highlighted with a red outline and the full statistics for the authority will appear on the left-hand panel.
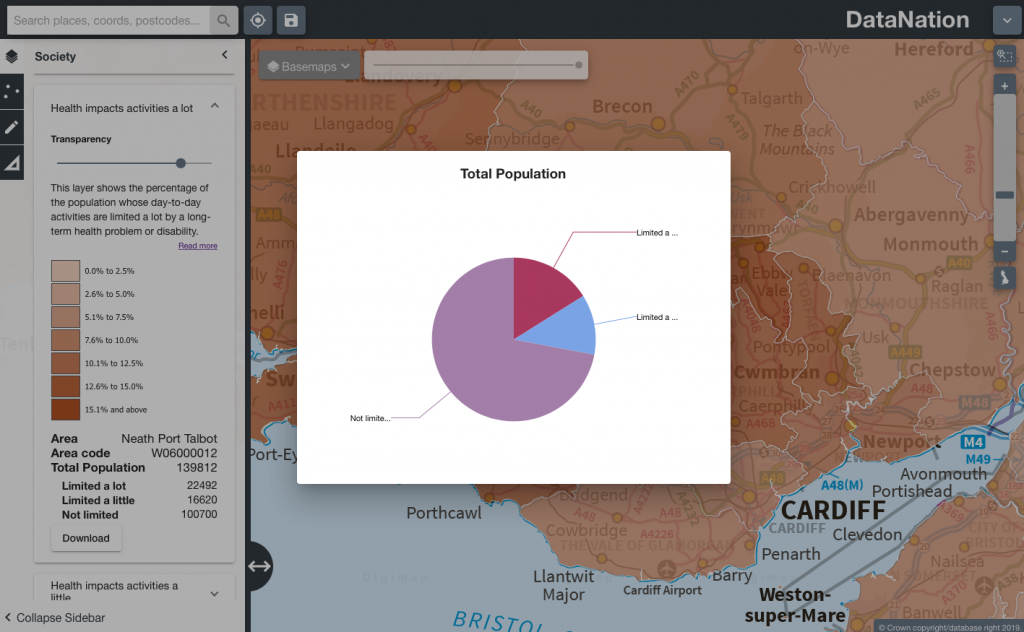
- The data on the left-hand panel shows all the related statistics for that area about how health impacts activities. Click on the different levels of data to view a pie chart of the data.
- Click to view the other health impact datasets and look at the patterns of activity across the country and your local area.
Questions, Analysis and Interpretation
- Describe the Health impacts activities a lot data for your local authority, calculate percentages of the different categories to help understand the detail for your local authority
- Compare with some other authorities (selecting one at a time) do neighbouring local authorities have similar patterns of economic activity?
- Are there any distinct geography patterns for the different levels of health impact? Where do you find the highest percentages of these groups in urban or rural areas?
- Now zoom further into your area of interest, you will see the local authority is broken down into smaller units. Describe the patterns of health impacts across the local authority, how much variation is there?
- Click on the smaller areas to view the raw data
- Zoom into even greater detail and repeat steps 2 & 3.
Exercise 3
- Extend this investigation by downloading the raw data for your area of interest(s) by clicking the Download button at the end of the raw data table. Open this data in Excel. Organise and present the data to support your interpretation of the pattern health impacts in the 2011 Census.
- Consider the relationships between health impacts and other census datasets. Think about which datasets you expect to see a correlation between activities impacted a lot by health. How does having a long-term health problem or disability impact other factors such as economic activity, education, type of work or household tenure? View those datasets and download data to compare.

This work is licensed under a Creative Commons Attribution-NonCommercial-ShareAlike 4.0 International License.