
Car or Van Availability
This resource involves investigation of the Car or Van availability data from the 2011 Census.
Click through the tabs below to view, or download the resource as a PDF file.
This resource involves investigation of the Car or Van availability data from the 2011 Census. This dataset reports the number of cars or vans available to members of households, broken down into categories of: no cars/vans, 1 car/van, 2 cars/vans, 3 cars/vans and 4 or more cars/vans. In DataNation, you can visualise these variables to explore the patterns of availability across Great Britain[1].
Students will use the data to analyse the pattern of car ownership across GB compared to their own local area.
[1]Note that for better display purposes, the variables of 3 cars/vans and 4 or more cars/vans have been grouped together to give a single 3 or more layer.
News item on families being pressurised into owning a car: ‘Scots families with tight incomes ‘forced’ into car ownership’ reported in the Scotsman (10 February, 2017) https://www.scotsman.com/news/transport/scots-families-with-tight-incomes-forced-into-car-ownership-1-4362508
-
- Go to the DataNation homepage: http://datanation.edina.ac.uk
- Enter your school’s username and password and click login.
Exercise 1.
In this exercise, you will explore the mapping layers to visually interpret the Census data about car availability.
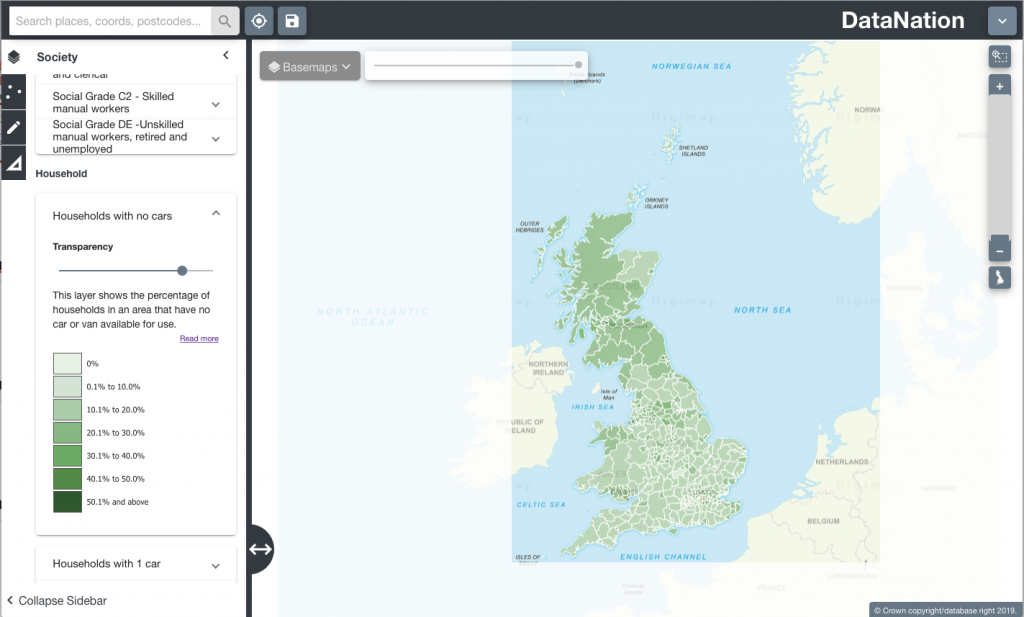
Begin by displaying the ‘Households with no cars’ layer:
- Click the Society tab in the left-hand panel
- Scroll down to the Household section of available layers and click on the ‘Households with no cars
- The map view will update and display the percentage of households that are socially rented across Great Britain. Ensure you are zoomed out to view the whole country.
- Explore the data by zooming in (double-click the mouse or use the zoom bar on the top right) and panning the map.
- View the other Car availability layers one by one to view the different availability across the country and your area of interest.
- Questions, Analysis and Interpretation
- Viewing GB as a whole, what can you conclude about car ownership across Local Authorities?
- How does car availability vary between rural and urban areas?
- Where are the higher percentage of households with 3 or more cars?
Exercise 2
In this exercise you will explore the raw data behind the maps.
- Click on the map to select a single Local Authority.The selected authority will be highlighted with a red outline and the full statistics for the authority will appear on the left-hand panel.
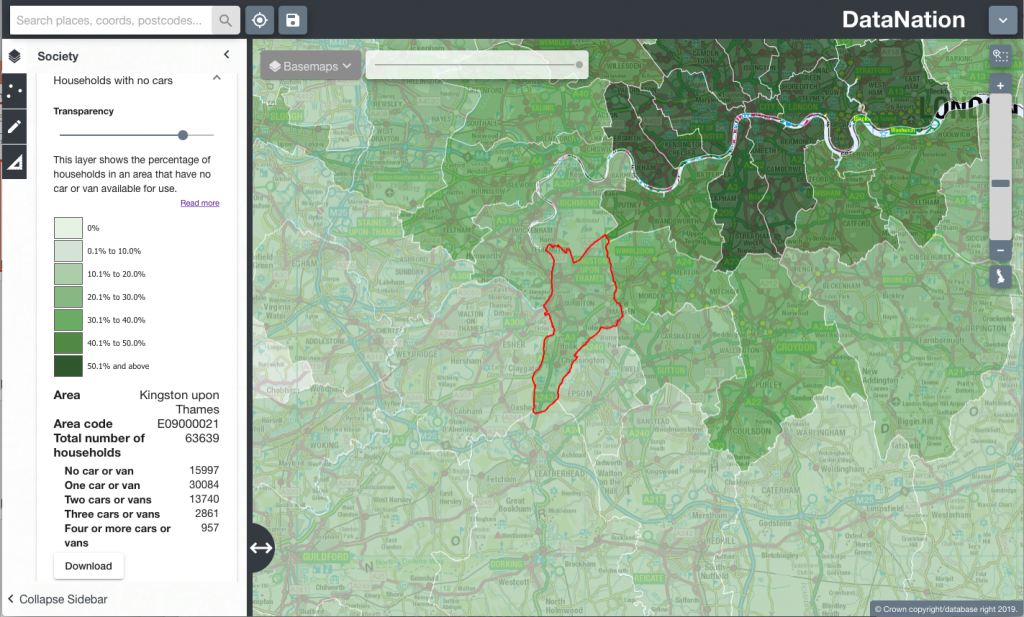
- The data on the left-hand panel shows all the related statistics for that area in the Households with no cars dataset. It shows the total number of households in the selected area, and then breaks down in more detail the number of cars available to households in the area.
Questions, Analysis and Interpretation
- Describe the data under ‘Households with no cars’ for your selected Local Authority
- Compare with some other authorities (selecting one at a time) do neighbouring local authorities have similar patterns of availability?
- Now zoom further into your area of interest, you will see the local authority is broken down into smaller units. Describe the patterns of availability across the local authority, how much variation is there?
- Click on the smaller areas to view the raw data
- Zoom into even greater detail and repeat steps 2 & 3.
Exercise 3
Extend this investigation by exploring other datasets that you think may show issues that impact the levels of car availability, for example: Age, Employment, Families with children, to explain structure and patterns of car ownership nationally and locally.

This work is licensed under a Creative Commons Attribution-NonCommercial-ShareAlike 4.0 International License.